Heatwave detection#
According to the Intergovernmental Panel on Climate Change (IPCC), a heatwave can be defined as “a period of abnormally hot weather, often defined with reference to a relative temperature threshold, lasting from two days to months” (Al Khourdajie et al., 2022). Such a definition is rather vague and can be easily adapted to depending on the local context. For instance, MeteoSwiss distinguishes between four level of heat warnings (Burgstall et al., 2021) depending on both the period duration and temperature thresholds.
This notebook shows how meteora can be used to detect heatwave periods, providing the user with flexibility to adapt to local heatwave definitions. To that end, we will use the Swiss Federal Office of Meteorology and Climatology (MeteoSwiss) dataset. Let us start with some imports:
import datetime as dt

import contextily as cx
import matplotlib.pyplot as plt
import pandas as pd

from meteora import clients, utils

figwidth, figheight = plt.rcParams["figure.figsize"]
We will get the MeteoSwiss data for the June-July-August (JJA) periods of 2022 to 2024 for an area surrounding the city of Zurich (Switzerland):
region = "Zurich, Switzerland"
# select study period
start_year = 2022
end_year = 2024
# months to consider when querying the MeteoSwiss data
start_month = 6
end_month = 8
We can first plot the station locations:
client = clients.MeteoSwissClient(region)
ax = client.stations_gdf.plot()
cx.add_basemap(ax, crs=client.stations_gdf.crs, attribution="")
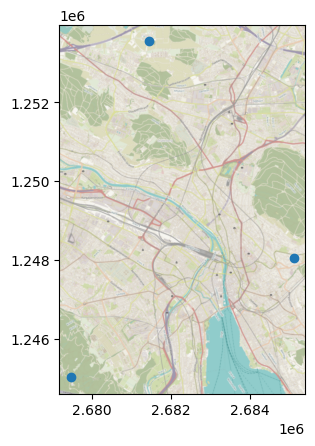
(C) OpenStreetMap contributors, Tiles style by Humanitarian OpenStreetMap Team hosted by OpenStreetMap France
Then, we will get the JJA time series of temperature measurements:
ts_df = pd.concat(
    [
        client.get_ts_df(
            "temperature",
            dt.date(year, start_month, 1),
            # get latest moment of the latest day of the month
            # ACHTUNG: this won't work if `end_month` is 12 (see commented code below)
            dt.datetime.combine(
                dt.date(year, end_month + 1, 1) - dt.timedelta(days=1), dt.time.max
            ),
            # dt.date(year + int(end_month / 12), (end_month % 12) + 1, 1)
            # - dt.timedelta(days=1),
        )
        for year in range(start_year, end_year + 1)
    ],
    axis="rows",
)
# convert to wide format
ts_df = utils.long_to_wide(ts_df)
ts_df
| station_id | REH | SMA | UEB |
|---|---|---|---|
| time | |||
| 2022-06-01 00:00:00+00:00 | 11.6 | 13.8 | NaN |
| 2022-06-01 00:10:00+00:00 | 12.1 | 13.8 | NaN |
| 2022-06-01 00:20:00+00:00 | 12.2 | 13.8 | NaN |
| 2022-06-01 00:30:00+00:00 | 11.1 | 13.6 | NaN |
| 2022-06-01 00:40:00+00:00 | 11.1 | 13.5 | NaN |
| ... | ... | ... | ... |
| 2024-08-31 23:10:00+00:00 | 19.5 | 21.0 | NaN |
| 2024-08-31 23:20:00+00:00 | 18.7 | 20.7 | NaN |
| 2024-08-31 23:30:00+00:00 | 19.4 | 20.7 | NaN |
| 2024-08-31 23:40:00+00:00 | 19.2 | 20.5 | NaN |
| 2024-08-31 23:50:00+00:00 | 17.9 | 20.5 | NaN |
39744 rows × 3 columns
According to the MeteoSwiss heat warning system, a level 4 warning is issued when the daily mean temperature is equal or greater than 27°C for at least 3 days. In order to detect a period with such characteristics, we can use the meteora.utils.get_heatwave_periods function, which takes a time series data frame as the only positional argument, followed by a series of keyword-only arguments. For this example, we need to set:
heatwave_t_thresholdas the temperature threshold (the default is 25)heatwave_n_consecutive_daysas the number of consecutive days (the default is 3)station_agg_funcas the function to aggregate each station’s daily time series (the default is “mean”
heatwave_periods = utils.get_heatwave_periods(
    ts_df,
    heatwave_t_threshold=27,
    heatwave_n_consecutive_days=3,
    station_agg_func="mean",
)
heatwave_periods
[]
As we can see, there is no heatwave fullfilling these characteristics for our study area during the specified period. Let us now try to find periods of level 3 warnings, i.e., when the mean daily temperature is equal or greater than 25°C for at least 3 days:
heatwave_periods = utils.get_heatwave_periods(
    ts_df,
    heatwave_t_threshold=25,
    heatwave_n_consecutive_days=3,
    station_agg_func="mean",
)
heatwave_periods
[(datetime.datetime(2023, 8, 19, 0, 0),
  datetime.datetime(2023, 8, 24, 23, 59, 59, 999999))]
We get a single heatwave that spans from the 19th to the 24th of August 2023. We can also use this information to extract the time series of this period:
heatwave_start, heatwave_end = heatwave_periods[0]
ts_df.loc[heatwave_start:heatwave_end].plot()
---------------------------------------------------------------------------
TypeError                                 Traceback (most recent call last)
Cell In[7], line 2
      1 heatwave_start, heatwave_end = heatwave_periods[0]
----> 2 ts_df.loc[heatwave_start:heatwave_end].plot()

File ~/checkouts/readthedocs.org/user_builds/meteora/checkouts/latest/.pixi/envs/doc/lib/python3.13/site-packages/pandas/core/indexing.py:1207, in _LocationIndexer.__getitem__(self, key)
   1205 maybe_callable = com.apply_if_callable(key, self.obj)
   1206 maybe_callable = self._raise_callable_usage(key, maybe_callable)
-> 1207 return self._getitem_axis(maybe_callable, axis=axis)

File ~/checkouts/readthedocs.org/user_builds/meteora/checkouts/latest/.pixi/envs/doc/lib/python3.13/site-packages/pandas/core/indexing.py:1429, in _LocIndexer._getitem_axis(self, key, axis)
   1427 if isinstance(key, slice):
   1428     self._validate_key(key, axis)
-> 1429     return self._get_slice_axis(key, axis=axis)
   1430 elif com.is_bool_indexer(key):
   1431     return self._getbool_axis(key, axis=axis)

File ~/checkouts/readthedocs.org/user_builds/meteora/checkouts/latest/.pixi/envs/doc/lib/python3.13/site-packages/pandas/core/indexing.py:1461, in _LocIndexer._get_slice_axis(self, slice_obj, axis)
   1458     return obj.copy(deep=False)
   1460 labels = obj._get_axis(axis)
-> 1461 indexer = labels.slice_indexer(slice_obj.start, slice_obj.stop, slice_obj.step)
   1463 if isinstance(indexer, slice):
   1464     return self.obj._slice(indexer, axis=axis)

File ~/checkouts/readthedocs.org/user_builds/meteora/checkouts/latest/.pixi/envs/doc/lib/python3.13/site-packages/pandas/core/indexes/datetimes.py:1072, in DatetimeIndex.slice_indexer(self, start, end, step)
   1064 # GH#33146 if start and end are combinations of str and None and Index is not
   1065 # monotonic, we can not use Index.slice_indexer because it does not honor the
   1066 # actual elements, is only searching for start and end
   1067 if (
   1068     check_str_or_none(start)
   1069     or check_str_or_none(end)
   1070     or self.is_monotonic_increasing
   1071 ):
-> 1072     return Index.slice_indexer(self, start, end, step)
   1074 mask = np.array(True)
   1075 in_index = True

File ~/checkouts/readthedocs.org/user_builds/meteora/checkouts/latest/.pixi/envs/doc/lib/python3.13/site-packages/pandas/core/indexes/base.py:6804, in Index.slice_indexer(self, start, end, step)
   6753 def slice_indexer(
   6754     self,
   6755     start: Hashable | None = None,
   6756     end: Hashable | None = None,
   6757     step: int | None = None,
   6758 ) -> slice:
   6759     """
   6760     Compute the slice indexer for input labels and step.
   6761
   (...)   6802     slice(1, 3, None)
   6803     """
-> 6804     start_slice, end_slice = self.slice_locs(start, end, step=step)
   6806     # return a slice
   6807     if not is_scalar(start_slice):

File ~/checkouts/readthedocs.org/user_builds/meteora/checkouts/latest/.pixi/envs/doc/lib/python3.13/site-packages/pandas/core/indexes/base.py:7062, in Index.slice_locs(self, start, end, step)
   7060 start_slice = None
   7061 if start is not None:
-> 7062     start_slice = self.get_slice_bound(start, "left")
   7063 if start_slice is None:
   7064     start_slice = 0

File ~/checkouts/readthedocs.org/user_builds/meteora/checkouts/latest/.pixi/envs/doc/lib/python3.13/site-packages/pandas/core/indexes/base.py:6964, in Index.get_slice_bound(self, label, side)
   6960 original_label = label
   6962 # For datetime indices label may be a string that has to be converted
   6963 # to datetime boundary according to its resolution.
-> 6964 label = self._maybe_cast_slice_bound(label, side)
   6966 # we need to look up the label
   6967 try:

File ~/checkouts/readthedocs.org/user_builds/meteora/checkouts/latest/.pixi/envs/doc/lib/python3.13/site-packages/pandas/core/indexes/datetimes.py:1033, in DatetimeIndex._maybe_cast_slice_bound(self, label, side)
   1024     warnings.warn(
   1025         # GH#35830 deprecate last remaining inconsistent date treatment
   1026         "Slicing with a datetime.date object is deprecated. "
   (...)   1029         stacklevel=find_stack_level(),
   1030     )
   1032 label = super()._maybe_cast_slice_bound(label, side)
-> 1033 self._data._assert_tzawareness_compat(label)
   1034 return Timestamp(label)

File ~/checkouts/readthedocs.org/user_builds/meteora/checkouts/latest/.pixi/envs/doc/lib/python3.13/site-packages/pandas/core/arrays/datetimes.py:800, in DatetimeArray._assert_tzawareness_compat(self, other)
    796         raise TypeError(
    797             "Cannot compare tz-naive and tz-aware datetime-like objects."
    798         )
    799 elif other_tz is None:
--> 800     raise TypeError(
    801         "Cannot compare tz-naive and tz-aware datetime-like objects"
    802     )

TypeError: Cannot compare tz-naive and tz-aware datetime-like objects
Since there are three stations in our study area, we have three daily means to compare with heatwave_t_threshold. By default, the meteora.utils.get_heatwave_periods function will compare the threshold with the mean among all stations of ts_df, however we can change this behaviour through the inter_station_agg_func keyword argument. For instance, we can set to "max" so that a day is considered as a potential part of a heatwave when (at least) one of the stations is over the temperature threshold:
heatwave_periods = utils.get_heatwave_periods(
    ts_df,
    heatwave_t_threshold=25,
    heatwave_n_consecutive_days=3,
    station_agg_func="mean",
    inter_station_agg_func="max",
)
heatwave_periods
When using such a criteria we obtain two heatwaves instead of one. The function intents to offer flexibility so that the user can easily adapt it to different heatwave definitions. For instance, we could also change the station_agg_func to "max" to compare the temperature threshold with the maximum daily temperature of each station, instead of the mean. However, the mean temperature is often most correlated with epidemiological impacts of heat stress because it also reflects night-time temperatures (Burgstall et al., 2021).
Instead of getting the periods, we can use the meteora.utils.get_heatwave_ts_df function to get their corresponding time series data:
heatwave_ts_df = utils.get_heatwave_ts_df(ts_df, heatwave_periods=heatwave_periods)
heatwave_ts_df.head()
We now get a multi-indexed time series data frame where the outermost index is the heatwave identifier and the innermost index is the time. We can use this data frame, e.g., to plot the time series of each heatwave separately:
heatwave_gb = heatwave_ts_df.groupby("heatwave")
fig, axes = plt.subplots(
    nrows=1, ncols=len(heatwave_gb), figsize=(len(heatwave_gb) * figwidth, figheight)
)
for (heatwave, _ts_df), ax in zip(heatwave_gb, axes):
    _ts_df.droplevel("heatwave").plot(ax=ax)
    ax.set_title(f"Heatwave {heatwave}")
    ax.set_ylabel("Temperature (°C)")
    ax.set_xlabel("Time")
    # rotate x-axis labels
    ax.tick_params(axis="x", rotation=45)
We can also use the meteora.utils.get_heatwave_ts_df to get the time series data frame for the heatwave periods directly, without having to first get the periods. To that end, instead of providing the heatwave_periods argument, we can use the same keyword arguments as in the meteora.utils.get_heatwave_periods function:
heatwave_ts_df = utils.get_heatwave_ts_df(
    ts_df,
    heatwave_t_threshold=25,
    heatwave_n_consecutive_days=3,
    station_agg_func="mean",
    inter_station_agg_func="max",
)
heatwave_ts_df.head()
References#
A. Al Khourdajie, R. van Diemen, W. F. Lamb, M. Pathak, A. Reisinger, J. Skea, and L. Steg. Annex ii: definitions, units and conventions. 2022. In: IPCC, 2022. Climate Change 2022: Mitigation of Climate Change.