Climate indices with xclim integration#
In this notebook, we show how Meteora supports the computation of climate indices via the climate_indices module, which process the time-series data frames as obtained by Meteora’s clients into the inputs of several of the climate indices implemented in xclim.
import datetime as dt

import contextily as cx
import geopandas as gpd
import matplotlib.pyplot as plt
import seaborn as sns
from shapely import geometry

from meteora import clients, climate_indices, units
We will use MeteoSwiss stations around Zurich and focus on the June to August periods (JJA) of 2024:
region_bbox = [8.34, 47.28, 8.67, 47.54]
region = gpd.GeoSeries(geometry.box(*region_bbox), crs="epsg:4326")
# select study period
year = 2024
# months to consider when querying the data
start_month = 6
end_month = 8
# variables
variables = ["temperature", "relative_humidity", "precipitation", "wind_speed"]
# viz
cmap = "coolwarm"
figwidth = plt.rcParams["figure.figsize"][0]
figheight = plt.rcParams["figure.figsize"][0]
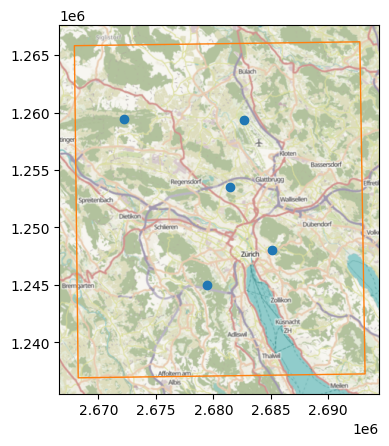
We will start by plotting the MeteoSwiss stations in the study area:
client = clients.MeteoSwissClient(region)
colors = sns.color_palette()
ax = client.stations_gdf.plot(color=colors[0])
client.region.plot(ax=ax, facecolor=(0, 0, 0, 0), edgecolor=colors[1])
cx.add_basemap(ax=ax, crs=client.stations_gdf.crs, attribution=False)
(C) OpenStreetMap contributors, Tiles style by Humanitarian OpenStreetMap Team hosted by OpenStreetMap France
We can now get the JJA time series of measurements for the target year:
ts_df = client.get_ts_df(
    variables,
    dt.date(year, start_month, 1),
    # get latest moment of the latest day of the month
    # ACHTUNG: this won't work if `end_month` is 12
    dt.datetime.combine(
        dt.date(year, end_month + 1, 1) - dt.timedelta(days=1), dt.time.max
    ),
)
ts_df.head()
| temperature | relative_humidity | precipitation | wind_speed | ||
|---|---|---|---|---|---|
| station_id | time | ||||
| KLO | 2024-06-01 00:00:00+00:00 | 10.5 | 93.9 | 0.3 | 1.6 |
| 2024-06-01 00:10:00+00:00 | 10.5 | 96.8 | 0.3 | 1.9 | |
| 2024-06-01 00:20:00+00:00 | 10.7 | 94.9 | 0.3 | 1.8 | |
| 2024-06-01 00:30:00+00:00 | 10.5 | 97.0 | 0.2 | 1.8 | |
| 2024-06-01 00:40:00+00:00 | 10.5 | 94.9 | 0.1 | 2.5 |
Climate indices and input climate variables#
We can compute several climate indices using temperature data only, which can be as simple as the number of “hot days” with daily maximum temperature exceeds a given threshold:
hot_days_df = climate_indices.hot_days(
    ts_df,
    thresh="30.0 degC",
    freq="YS",
)
hot_days_df.head()
---------------------------------------------------------------------------
TypeError                                 Traceback (most recent call last)
Cell In[5], line 1
----> 1 hot_days_df = climate_indices.hot_days(
      2     ts_df,
      3     thresh="30.0 degC",
      4     freq="YS",
      5 )
      6 hot_days_df.head()

File ~/checkouts/readthedocs.org/user_builds/meteora/checkouts/latest/meteora/climate_indices.py:478, in hot_days(ts_df, thresh, freq, temperature_col, temperature_unit)
    469 ts_da = _to_xarray_resampled(
    470     ts_df,
    471     temperature_col,
   (...)    474     agg="max",
    475 )
    477 # compute index, transpose to have time as index and station ids as columns
--> 478 return _to_pandas(xci.hot_days(ts_da, thresh=thresh, freq=freq))

File <boltons.funcutils.FunctionBuilder-25>:2, in hot_days(tasmax, thresh, freq)

File ~/checkouts/readthedocs.org/user_builds/meteora/checkouts/latest/.pixi/envs/doc/lib/python3.13/site-packages/xclim/core/units.py:1487, in declare_units.<locals>.dec.<locals>.wrapper(*args, **kwargs)
   1484 for name, dim in units_by_name.items():
   1485     check_units(bound_args.arguments.get(name), dim)
-> 1487 out = func(*args, **kwargs)
   1489 _check_output_has_units(out)
   1491 return out

File ~/checkouts/readthedocs.org/user_builds/meteora/checkouts/latest/.pixi/envs/doc/lib/python3.13/site-packages/xclim/indices/_simple.py:369, in hot_days(tasmax, thresh, freq)
    367 thresh = convert_units_to(thresh, tasmax)
    368 out = threshold_count(tasmax, ">", thresh, freq)
--> 369 return to_agg_units(out, tasmax, "count", deffreq="D")

File ~/checkouts/readthedocs.org/user_builds/meteora/checkouts/latest/.pixi/envs/doc/lib/python3.13/site-packages/xclim/core/units.py:704, in to_agg_units(out, orig, op, dim, deffreq)
    701     out.attrs.update(units="1", is_dayofyear=np.int32(1), calendar=get_calendar(orig))
    703 elif op in ["count", "integral"]:
--> 704     m, freq_u_raw = infer_sampling_units(orig, deffreq=deffreq, dim=dim)
    705     orig_u = units2pint(orig)
    706     freq_u = str2pint(freq_u_raw)

File ~/checkouts/readthedocs.org/user_builds/meteora/checkouts/latest/.pixi/envs/doc/lib/python3.13/site-packages/xclim/core/units.py:532, in infer_sampling_units(da, deffreq, dim)
    507 """
    508 Infer a multiplier and the units corresponding to one sampling period.
    509
   (...)    529     If the frequency has no corresponding units.
    530 """
    531 da = da[dim]
--> 532 freq = xr.infer_freq(da)
    533 if freq is None:
    534     if deffreq is None:

File ~/checkouts/readthedocs.org/user_builds/meteora/checkouts/latest/.pixi/envs/doc/lib/python3.13/site-packages/xarray/coding/frequencies.py:89, in infer_freq(index)
     87 if index.ndim != 1:
     88     raise ValueError("'index' must be 1D")
---> 89 elif not _contains_datetime_like_objects(Variable("dim", index)):
     90     raise ValueError("'index' must contain datetime-like objects")
     91 dtype = np.asarray(index).dtype

File ~/checkouts/readthedocs.org/user_builds/meteora/checkouts/latest/.pixi/envs/doc/lib/python3.13/site-packages/xarray/core/common.py:2102, in _contains_datetime_like_objects(var)
   2098 def _contains_datetime_like_objects(var: T_Variable) -> bool:
   2099     """Check if a variable contains datetime like objects (either
   2100     np.datetime64, np.timedelta64, or cftime.datetime)
   2101     """
-> 2102     return is_np_datetime_like(var.dtype) or contains_cftime_datetimes(var)

File ~/checkouts/readthedocs.org/user_builds/meteora/checkouts/latest/.pixi/envs/doc/lib/python3.13/site-packages/xarray/core/common.py:2070, in is_np_datetime_like(dtype)
   2068 def is_np_datetime_like(dtype: DTypeLike | None) -> bool:
   2069     """Check if a dtype is a subclass of the numpy datetime types"""
-> 2070     return np.issubdtype(dtype, np.datetime64) or np.issubdtype(dtype, np.timedelta64)

File ~/checkouts/readthedocs.org/user_builds/meteora/checkouts/latest/.pixi/envs/doc/lib/python3.13/site-packages/numpy/_core/numerictypes.py:534, in issubdtype(arg1, arg2)
    477 r"""
    478 Returns True if first argument is a typecode lower/equal in type hierarchy.
    479
   (...)    531
    532 """
    533 if not issubclass_(arg1, generic):
--> 534     arg1 = dtype(arg1).type
    535 if not issubclass_(arg2, generic):
    536     arg2 = dtype(arg2).type

TypeError: Cannot interpret 'datetime64[us, UTC]' as a data type
Let’s visualize the number of hot days per station in the study area:
hot_days_label = "N. hot days"
hot_days_gdf = gpd.GeoDataFrame(hot_days_df.T, geometry=client.stations_gdf["geometry"])
hot_days_gdf.columns = [hot_days_label, "geometry"]
ax = hot_days_gdf.plot(
    hot_days_label,
    cmap="coolwarm",
    edgecolor="k",
    legend=True,
    legend_kwds={"shrink": 0.5, "label": hot_days_label},
)
ax.set_axis_off()
cx.add_basemap(ax, crs=hot_days_gdf.crs, attribution=False)
(C) OpenStreetMap contributors, Tiles style by Humanitarian OpenStreetMap Team hosted by OpenStreetMap France
The computation of the hot days and other temperature-only indices will work as long as the input data frame contains a temperature column named “temperature” according to the meteora nomenclature. In the case where the temperature column has a different name, we need to provide that information explicitly through the temperature_col argument:
climate_indices.hot_days(
    ts_df.rename(columns={"temperature": "tre200s0"}), temperature_col="tre200s0"
)
Other climate indices require multiple climate variables as input. For instance, the heat index (Blazejczyk et al., 2012) requires temperature and relative humidity to estimate perceived temperature:
climate_indices.heat_index(ts_df)
Here, the input data frame must contain both a temperature column named “temperature” and another column named “relative_humidity”. If the columns have different names, we can provide them explicitly through the temperature_col and relative_humidity_col arguments.
Climate indices and their default arguments#
Most climate indices have additional arguments that can be used to customize their computation. For instance, note that while the heat index is computed at each time step, the hot days index aggregates the yearly counts. The yearly frequency is extracted from the signature of the underlying xclim method, in this case xclim.indices.hot_days, but we can choose another resampling frequency supported by xarray (e.g., the “month start” MS frequency):
climate_indices.hot_days(ts_df, freq="MS")
Similarly, we can provide a different threshold value after which a day is considered “hot”:
climate_indices.hot_days(
    ts_df,
    thresh="25 degC",
    freq="YS",
)
Units and xclim compatibility#
The xclim methods handle unit conversions when inputs include unit metadata, as it is the case with the time series returned by get_ts_df methods in Meteora - so indices work out of the box. For unit-naive data frames (e.g., custom data sources), you can pass explicit *_unit arguments, attach units with meteora.units.attach_units, or convert to canonical ECV units with meteora.units.convert_units.
For instance, consider the METARASOSIEMClient, which provides temperature in Fahrenheit, precipitation in inches and wind speed in knots:
metar_client = clients.METARASOSIEMClient(region)
metar_client._variable_units_dict
We can get the time series for the same period as before:
metar_ts_df = metar_client.get_ts_df(
    variables,
    dt.date(year, start_month, 1),
    # get latest moment of the latest day of the month
    # ACHTUNG: this won't work if `end_month` is 12
    dt.datetime.combine(
        dt.date(year, end_month + 1, 1) - dt.timedelta(days=1), dt.time.max
    ),
)
metar_ts_df
Because metar_ts_df includes units metadata, we can compute the hot days index directly and xclim will convert Fahrenheit internally:
climate_indices.hot_days(
    metar_ts_df,
)
If you drop the units metadata (or start from a unit-naive data frame), you need to provide the correct units explicitly, otherwise it would lead to misleading computed values:
metar_ts_df_naive = metar_ts_df.copy()
metar_ts_df_naive.attrs = {}

climate_indices.hot_days(
    metar_ts_df_naive,
)
For naive data frames, we can specify the units of each variable using the respective *_unit argument:
climate_indices.hot_days(metar_ts_df_naive, temperature_unit="degF")
Alternatively, we can attach units metadata to the unit-naive data frame using units.attach_units and compute the hot days index without providing the temperature_unit argument, since the data frame already carries the units metadata:
metar_ts_df_units = units.attach_units(
    metar_ts_df_naive,
    metar_client._variable_units_dict,
)
climate_indices.hot_days(
    metar_ts_df_units,
)
Supported indices (MeteoSwiss example)#
The climate indices from xclim currently implemented in meteora.climate_indices are:
sorted(climate_indices.__all__)
See also#
The xclim documentation on climate indices for a detailed overview of ther arguments and default values.
The heatwave detection notebook for heatwave detection and extraction of the underlying time series data of each heatwave.
References#
Krzysztof Blazejczyk, Yoram Epstein, Gerd Jendritzky, Hermann Staiger, and Birgit Tinz. Comparison of utci to selected thermal indices. International Journal of Biometeorology, 56(3):515–535, 2012.